Management evading questions during earnings calls along with declining KPIs: Complete Prompts & Workflow

Lets build a evasion index as a signal to detect deteriorating company moat, management execution issues, being able to handle hard questions from analysts.

Lets build a evasion index as a signal to detect deteriorating company moat, management execution issues, being able to handle hard questions from analysts.

Lets build a evasion index as a signal to detect deteriorating company moat, management execution issues, being able to handle hard questions from analysts.

TL;DR

  • Thesis. When uncertainty is rising or the outlook is weakening, management dodges hard questions. That evasiveness often precedes negative drift in the following 1–10 trading days.

  • Signal. We score each Q&A exchange for Answer Quality (0–10) and Evasion Severity (0–1), weight by materiality, and aggregate to a 0–100 AQG (higher = more evasive).

  • Use. Screen for rising AQG vs. baseline and deteriorating KPIs/guidance.

  • What’s included below. A copy-paste prompt (structured JSON output), a workflow to implement end-to-end, normalization and backtest guidance, plus guardrails and pitfalls.

Why evasiveness matters

Dodging specifics (“we’ll talk about it later,” vague ranges, answer-the-question-you-wanted-not-the-one-asked) is a behavioral micro-signal of risk. It’s not the same as negative sentiment; it’s a structure-of-answer effect. In practice, we’ve found it complements transcript sentiment, guidance changes, and classic NLP tone metrics.

Direction: Higher AQG = worse expected performance over the next 1–10 trading days.

Signal definition

We use two call-level aggregates:

  1. Evasion Index (AQG), 0–100 (higher = more evasive)

  2. Answer Quality, 0–100 (higher = better answers)

Both are computed from per-exchange scores, weighted by materiality. Optionally, you can track an AQ Spread = EvasionIndex − AnswerQuality as a single, gap-style number.

Implementation workflow

1) Data & preprocessing

  • Source: earnings call Q&A transcript.

  • Split the Q&A into exchanges: Analyst question + Management answer(s).

👉 Run a lightweight per-exchange summarizer so the downstream scoring prompt sees concise inputs.

2) Scoring with an LLM (prompt below)

For each exchange, the model assigns:

  • AnswerQuality_0to10 across five sub-dimensions (directness, completeness, quantification, time specificity, internal consistency).

  • EvasionSeverity_0to1 and EvasionType (deflection, vagueness, non-answer, delay_to_future_event, selective_answer, inconsistency).

  • MaterialityWeight_0to2 based on how central the topic is to valuation this quarter.

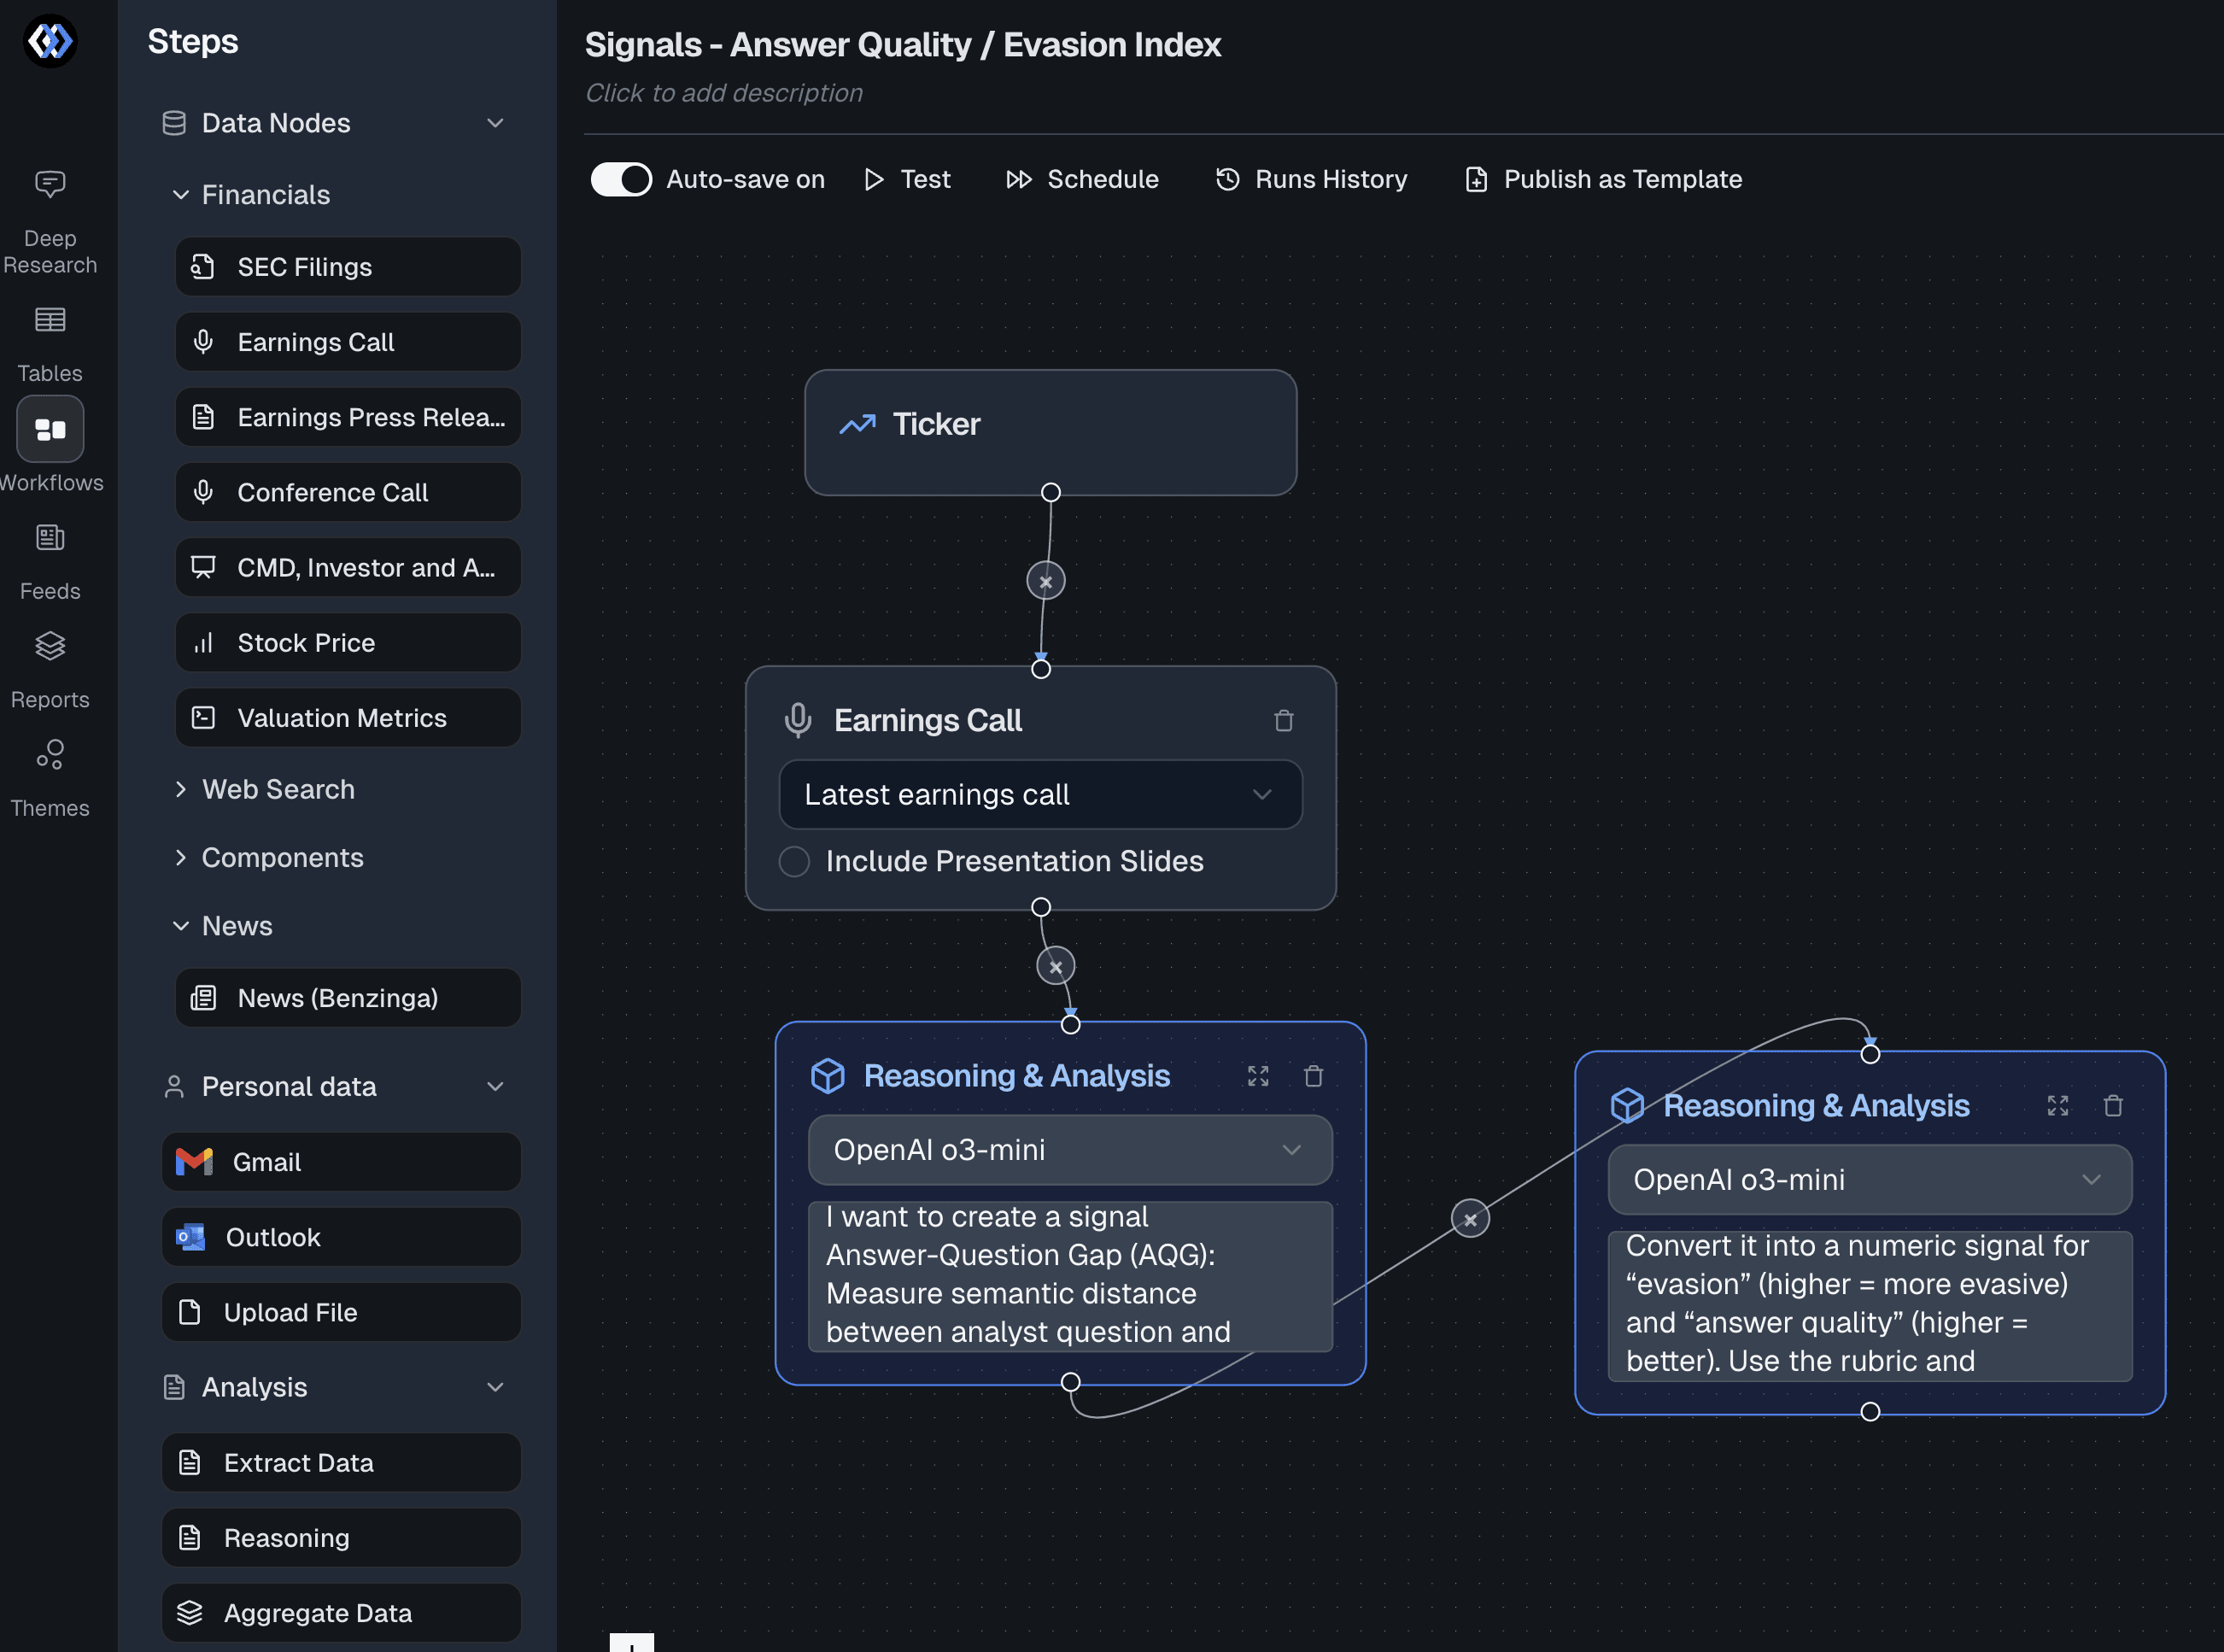
👉Run a reasoning prompt with best available model on the summarized earnings call. This context engineering is essential to extract the maximum quality deduction from the model. 


Roughly the workflow should look like the following (see the prompts down below 🔽): 

Matterfact is a finance specific workflow engine that streamlines building signal generation workflows. This above workflow is part of inbuilt signals you can use. Sign up for a free trial at https://app.matterfact.com/auth/sign-up

3) Aggregation (call-level)

Let there be N scored exchanges with valid materiality:

  • Evasion Index (AQG)
    EvasionIndex = 100 × ( Σ(EvasionSeverity_i × Materiality_i) / Σ(Materiality_i) )

  • Answer Quality
    AnswerQuality = 10 × ( Σ(AnswerQuality_i × Materiality_i) / Σ(Materiality_i) )

  • Evasion Incidence
    evasion_incidence = (# exchanges with EvasionSeverity ≥ 0.5) / N

  • Top evasive topics (max 3) by (EvasionSeverity × Materiality) with short evidence snippets.


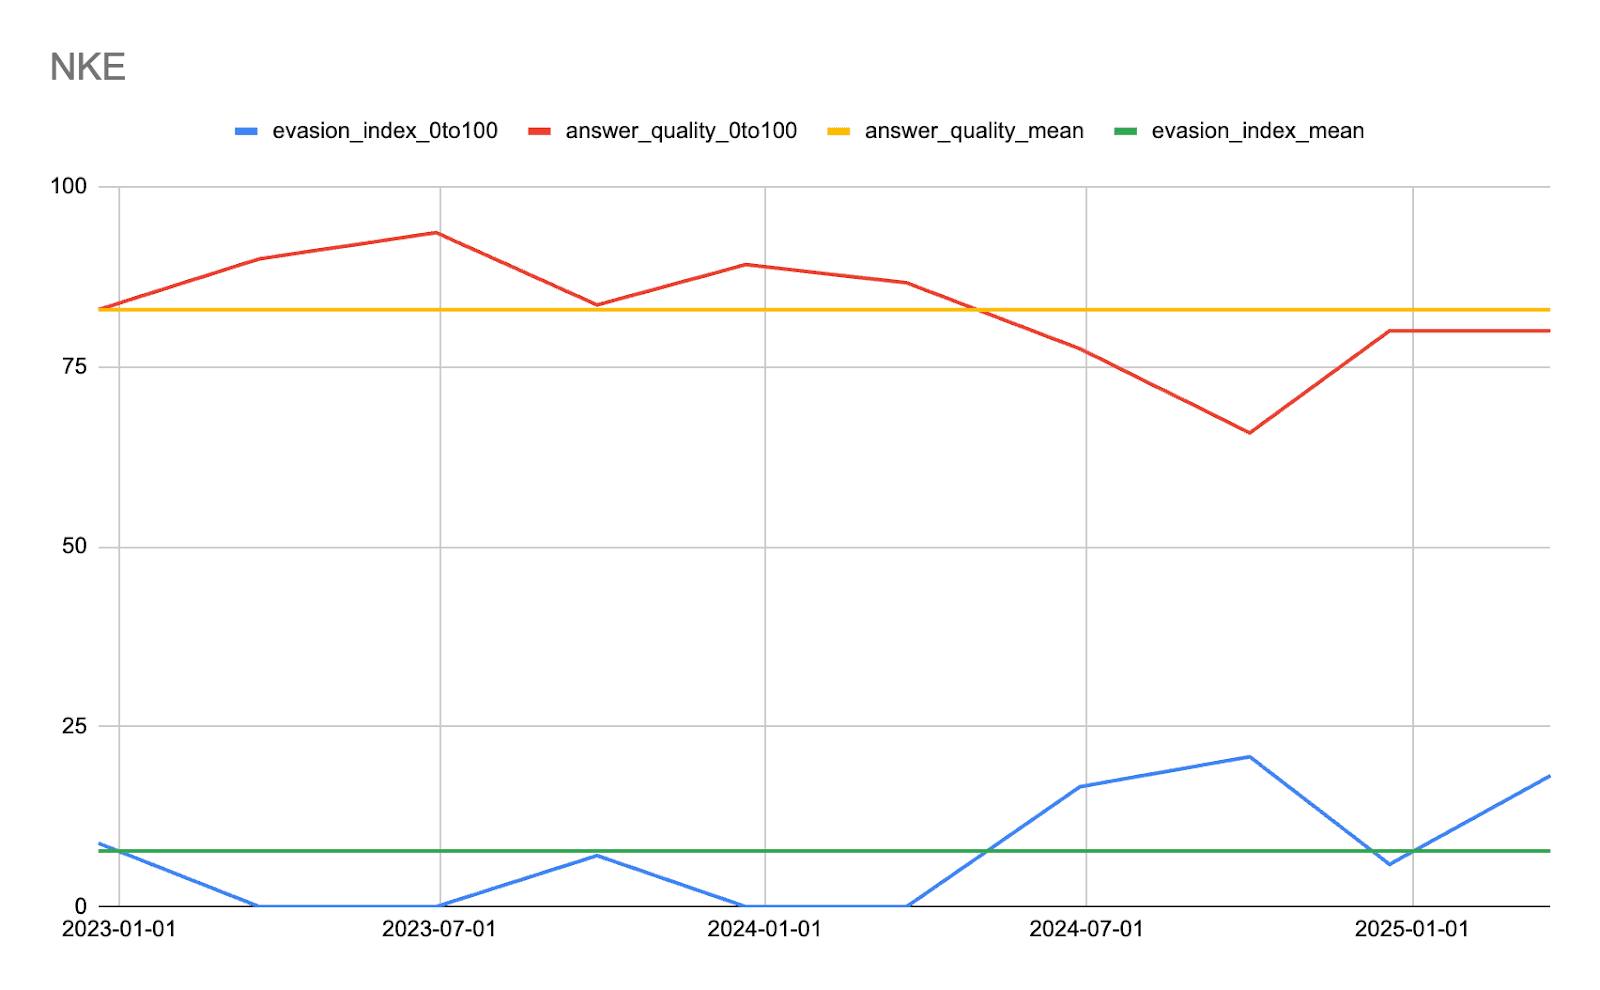
Example Signal Outputs

Nike as a company is increasingly facing issues and management is starting to evade analyst questions. The signal we built is showing signs of increasing evasion by management. 

4) Baselines & normalization (critical)

  • Company baseline: trailing 8 quarters.

  • Sector baseline: normalize within GICS industry—some sectors and CEOs are systematically vaguer.

  • Speaker effect: CFO vs. CEO differences—optional fixed effect if you have speaker attribution.

  • Z-score it: AQG_z = (AQG − mean_baseline) / std_baseline.

  • Screening rule: flag if AQG_z ≥ +1.0 (≈ top ~16%) or ≥ +20% above company baseline and KPIs/guidance show negative delta.


5) Screening logic

  • Primary trigger: AQG_z ≥ +1.0 or AQG ≥ baseline × 1.2

  • Confirmatory KPI rule: any of

    • Guidance cut vs. prior,

    • Negative KPI delta (e.g., traffic, same-store, order growth),

    • Adverse mix/margin signals.

  • Actionable list: top-N names meeting both conditions → push to PMs with top evasive topics snippets.


6) Deploy

  • Alerts: trigger when AQG_z crosses threshold and your KPI rule fires (see next section).

Dashboards: show time series of AQG, Answer Quality, incidence, and top evasive topics with snippets.

Copy-paste prompt (JSON-only output)

Use this prompt on the per-call analysis after you’ve summarized each exchange. The model will return a call-level JSON object plus a by_exchange array you can store for time-series analysis.


You are given an analyst–management Q&A analysis for an earnings call (already summarized per exchange). Convert it into a numeric signal for “evasion” (higher = more evasive) and “answer quality” (higher = better). Use the rubric and aggregation rules below. Output JSON only, matching the schema exactly (no prose).


---

### Scoring Rubric (per exchange)


Score AnswerQuality_0to10 using these five sub-dimensions (sum to 10):


1) Directness (0–3):

- 3 = Directly answers the question asked (all parts)

- 2 = Mostly direct; minor gaps

- 1 = Partially addresses; notable gaps

- 0 = Does not answer


2) Completeness (0–3):

- 3 = Provides sufficient detail to act (mechanics, drivers)

- 2 = Some detail, but missing key pieces

- 1 = Superficial

- 0 = No substance


3) Quantification (0–2):

- 2 = Provides explicit numbers/targets/ranges or clear KPIs

- 1 = Vague sizing/qualitative quantifiers only

- 0 = No quantification when appropriate


4) Time Specificity (0–1):

- 1 = Clear timing (dates/quarters/milestones)

- 0 = No timing


5) Internal Consistency vs. prompt’s “Evaluation” (0–1):

- 1 = Answer aligns with the provided evaluation notes

- 0 = Misaligned/contradictory


Then compute EvasionSeverity_0to1 from the provided “Evaluation” field and your rubric:

- 1.0 = Clear evasion (non-answer, deflection, promises of future disclosure without present answer)

- 0.5 = Partial evasion (answered one part, dodged key part)

- 0.0 = No evasion observed


Also classify EvasionType (array, any that apply):

- "deflection", "vagueness", "non_answer", "delay_to_future_event", "selective_answer", "inconsistency"

---

### Materiality Weighting (per exchange)


Estimate MaterialityWeight_0to2 based on topic importance to valuation for the period:

- 2.0 = Core P&L/guidance/capex/units/pricing/margins/traffic/China/U.S. comps/major initiatives central to the quarter

- 1.0 = Operational details that ladder to KPIs but are not primary drivers

- 0.5 = Peripheral


---


### Aggregation (call-level)


Let there be N exchanges with valid scoring.


1) Weighted Evasion Index (0–100)

EvasionIndex = 100 × (Σ(EvasionSeverity_i × MaterialityWeight_i) / Σ(MaterialityWeight_i))


2) Weighted Answer Quality (0–100)

AnswerQuality = 10 × (Σ(AnswerQuality_i × MaterialityWeight_i) / Σ(MaterialityWeight_i))


3) Incidence

evasion_incidence = (# exchanges with EvasionSeverity >= 0.5) / N


4) Top Evasive Topics

Return up to 3 topics with highest (EvasionSeverity × MaterialityWeight), each with a short topic label and evidence snippet (≤200 chars, paraphrased).


5) Confidence (0–1)

Start at 0.75; adjust:

+0.10 if N ≥ 8; +0.05 if N ≥ 12

−0.10 if >25% exchanges lack evaluation notes

−0.10 if avg materiality < 1.0

Clamp to [0,1].


6) Delta vs Prior Period (if provided)

delta_evasion = EvasionIndex - prior.EvasionIndex

delta_answer_quality = AnswerQuality - prior.AnswerQuality


---


### Output Format (strict JSON)


{

  "ticker": "{ticker}",

  "period": "{period_label}",

  "call_date": "{call_date_iso}",

  "n_exchanges": <int>,

  "evasion_index_0to100": <number>,

  "answer_quality_0to100": <number>,

  "evasion_incidence": <number>,

  "top_evasive_topics": [

    {

      "topic": "<short label>",

      "evasion_score_contribution": <number>, 

      "evidence_snippet": "<<=200 chars>"

    }

  ],

  "by_exchange": [

    {

      "idx": <int starting at 1>,

      "analyst": "<name if present>",

      "question_topic": "<short topic>",

      "materiality_weight_0to2": <number>,

      "answer_quality_0to10": <number>,

      "evasion_severity_0to1": <number>,

      "evasion_type": ["deflection" | "vagueness" | "non_answer" | "delay_to_future_event" | "selective_answer" | "inconsistency"],

      "notes": "<<=220 chars>"

    }

  ],

  "confidence_0to1": <number>,

  "deltas_vs_prior": {

    "has_prior": <true|false>,

    "delta_evasion": <number or null>,

    "delta_answer_quality": <number or null>

  },

  "version": "evasion_v1.0"

}


Rules:

- Emit valid JSON only.

- Do not invent details beyond the provided analysis; if a field is absent, infer minimally and note uncertainty in `notes`.

- Keep `by_exchange.notes` concise.

- Never include extra keys.


Now apply to the provided call and produce the JSON.

Pitfalls, and extensions

Pitfalls

  • Multi-part questions: score evasion only if the key part is dodged.

  • Legal/quiet periods and pending M&A can inflate AQG; annotate these and down-weight if needed.

  • Coverage bias: small N exchanges → lower confidence.

  • Sector style: baseline within sector to avoid penalizing culturally terse management teams.


Extensions

  • Speaker decomposition (CEO vs. CFO vs. COO).

  • Audio-only cues (hesitations, non-lexical fillers) as an add-on channel.

Narrative clusters: group evasive topics (pricing, capex, China, promotions) to see what’s getting slippery across a sector.

See more

research

from Matterfact

See more

research

from Matterfact

Impact of OBBA on Retail Sector

The OBBBA introduces major policy-driven risks and opportunities for retail and consumer staples, from welfare cuts and tariffs to labor, tax, and energy shifts. Value retailers like Walmart, Kroger, and Dollar General face top-line and cost pressures, while Target and Costco are more insulated. AI regulation relief benefits Amazon and Costco, but litigation and regulatory risk persist. Companies with strong balance sheets and supply chain agility are best positioned for the volatility ahead.

Impact of OBBA on Semis

Tech is navigating intense policy and macro headwinds. Export controls and supply chain risk are hitting AMD, NVIDIA, and Broadcom hard, while AI regulatory relief is a clear win for Microsoft, Google, AMD, and Broadcom. Legal, compliance, and execution risks are rising, but companies with strong liquidity, U.S. supply chain investments, and AI growth are best positioned. The outlook is split—AI-focused, U.S.-centric players lead, while export-heavy, levered firms face volatility.